With Strategic Insights, you can.
Garba automatically analyzes the themes you’re already tracking in your summary templates — like competitor mentions, pricing feedback, feature requests, and customer pain points — and surfaces patterns over time. Think of it as a business intelligence layer for your conversations.
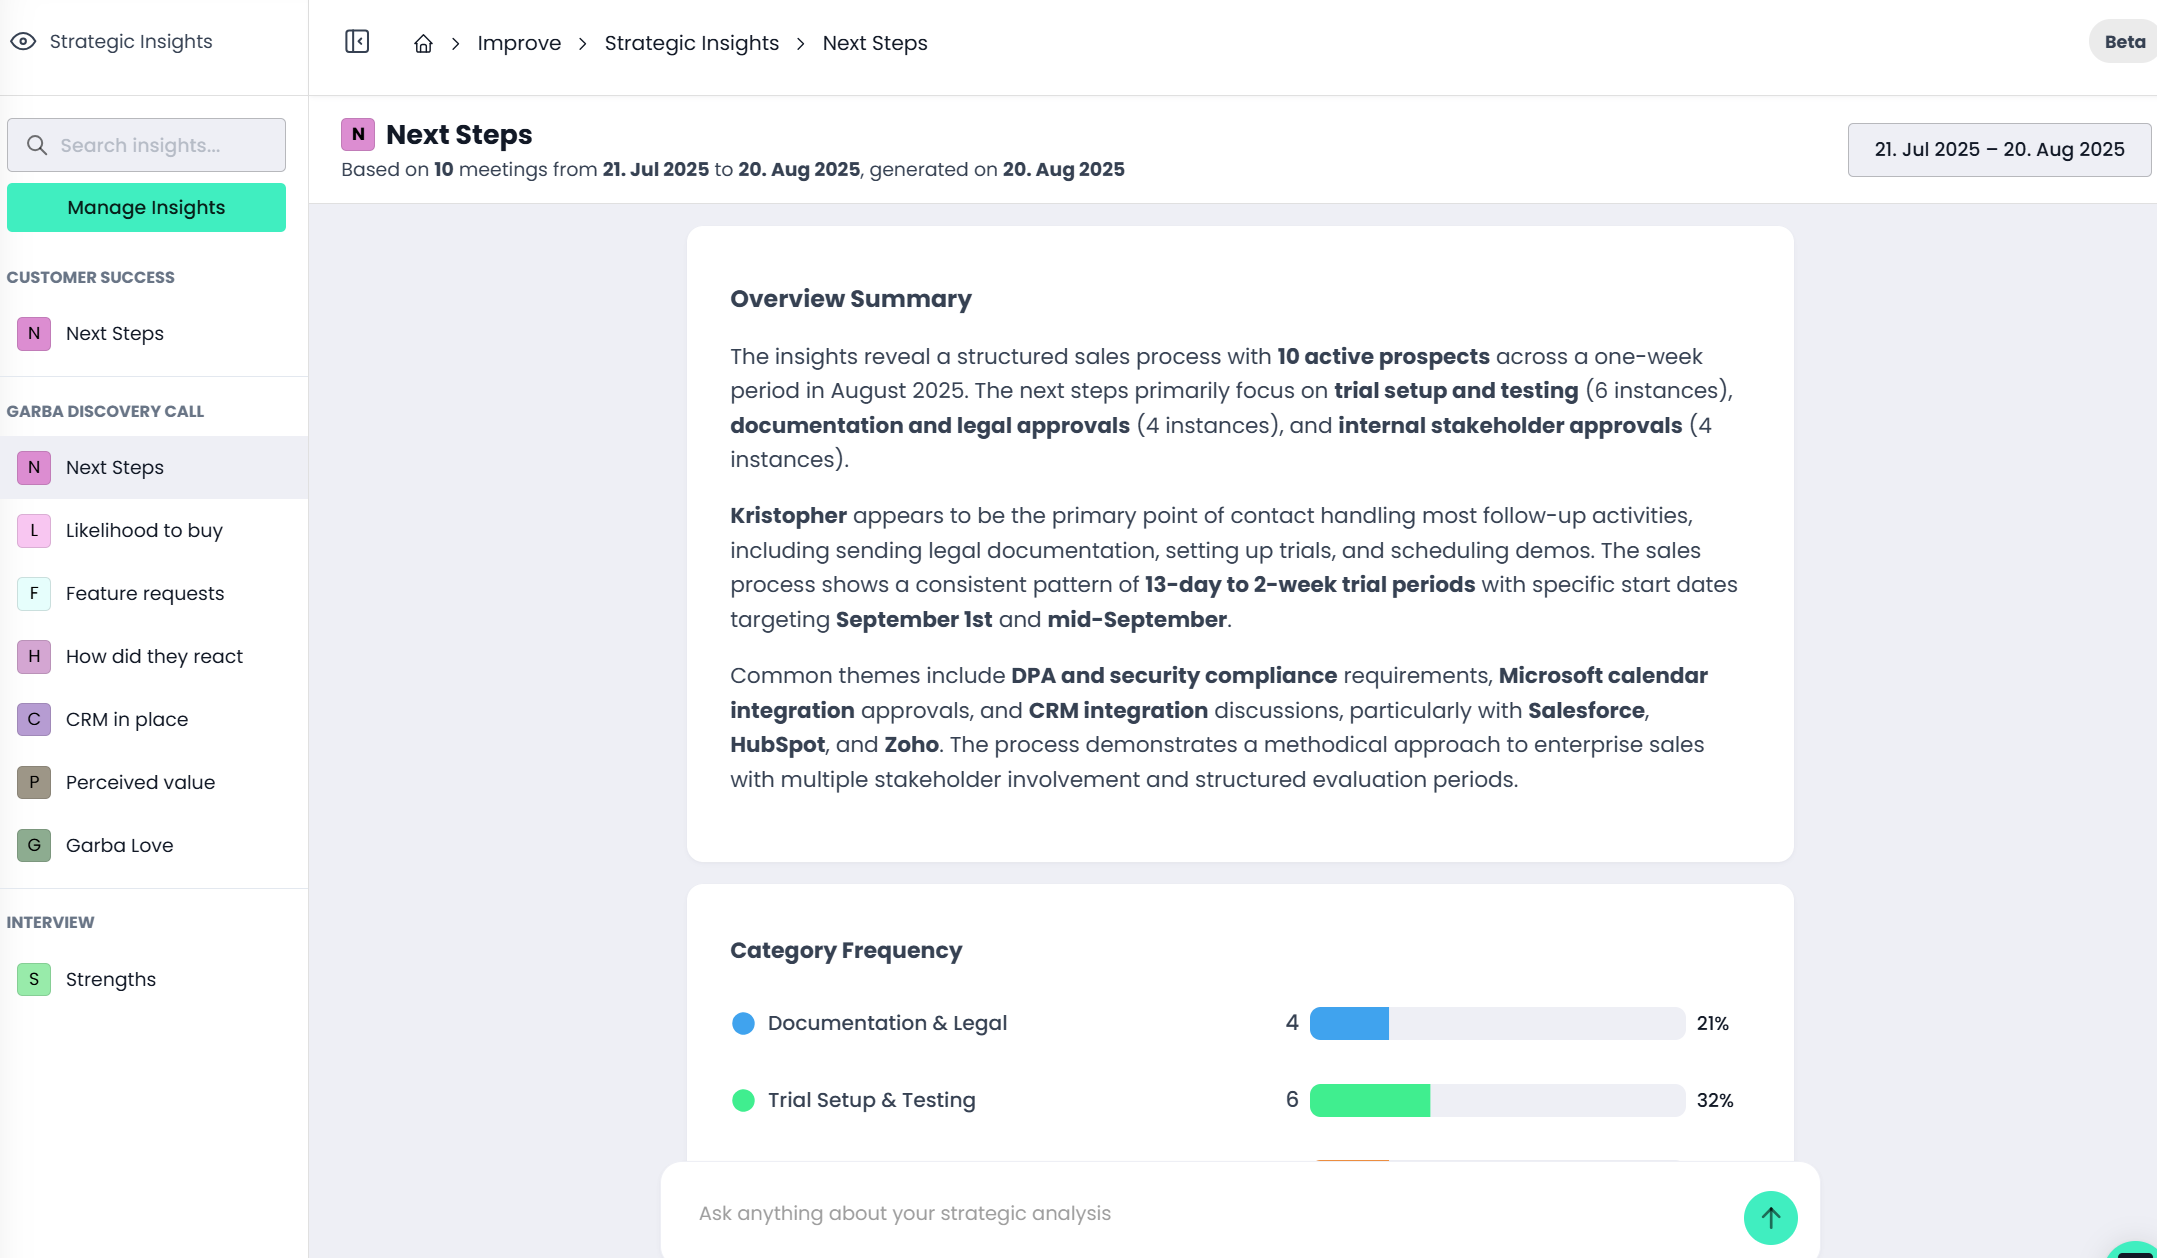
🔍 Spot recurring topics – Identify which themes (e.g., pricing, integrations, objections) come up most often.
📈 Track trends over time – See how conversation topics evolve across weeks or months.
📂 Drill down into details – Click into themes to view the exact meeting moments behind the data.
🎯 Inform smarter decisions – Turn customer conversations into actionable input for sales, product, and strategy.
In the left main menu, select Strategic Insights.
If no insights exist, you’ll be taken to the setup page.
Browse available categories from your summary templates.
Select the insight(s) you’d like to turn into Strategic Insights.
By default, Garba analyzes the last 30 days of meetings, but you can customize the time frame.
Note: At least 5 meetings must match the selected insight for a report to generate.
The dashboard is divided into five sections:
Overview Summary – High-level trends and recommendations.
Category Frequency – Charts showing how often topics appear over time.
Category Deep Dive – Detailed analysis of findings within each theme.
Notable Patterns – Highlights of surprising or important shifts.
Temporal Analysis – Seasonal or periodic conversation trends.
👉 In each section, you can click to drill down and view the exact meeting moments behind the data.
By default, the dashboard shows the last 30 days.
Use the date selector and click Generate to update the report to your preferred time frame.

At the bottom of the dashboard, you’ll see a chat bar.
Simply ask follow-up questions like:
“What specifically was mentioned about competitor X?”
“How big impact would implementing feature Y have?”
Garba will respond with insights pulled directly from your meeting data.
Start taking informed decisions powered by Garba!
